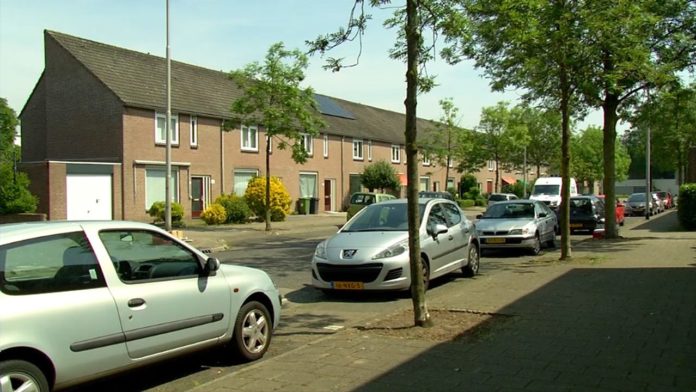
Eindhoven
The average WOZ value in the municipality of Eindhoven in 2021 was € 273,713. It is expected that this year the WOZ value will be on average € 298,488 within the municipality of Eindhoven. Thus, an increase of 8.3%.
Six different taxes are calculated on the basis of the WOZ value. The most well-known is the property tax (OZB). In the municipality of Eindhoven, the property tax rate in 2022 will be 0.1071% for homeowners. In addition, homeowners pay the water board levy and income tax (box 1) each year based on the WOZ value.
Reusel-De Mierden
With an increase of 16 percent, the WOZ value of the houses in Reusel-De Mierden rose the most. The most expensive houses are currently in the municipality of Vught. The average WOZ value of a home there is 423,000 euros. The top 10 municipalities look like this:
1. Vught: 423.000 euro
2. Waalre: 421.000 euro
3. Oirschot: 417.00 euro
4. Heeze-Leende: 412.000 euro
5. Nuenen, Gerwen en Nederwetten: 402.000 euro
6. Son en Breugel: 401.000 euro
7. Alphen-Chaam: 399.000 euro
8. Eersel: 397.000 euro
9. Sint-Michielsgestel: 396.000 euro
10. Reusel-De Mierden: 377.000 euro
Average increase
Reusel-De Mierden therefore increased the most compared to the WOZ value a year earlier. The top ten is as follows:
1. Reusel-De Mierden: 16.00%
2. Drimmel: 14.97%
3. First: 14.08%
4. Oss: 13.36%
5. Steenbergen: 12.60%
6. Best: 12.46%
7. Bernheze: 12.01%
8. Deurne: 11.84%
9. Helmond: 11.79%
10. Boekel: 11.65%
The WOZ value follows the price developments of owner-occupied homes, but with a one-year delay. The WOZ values in 2022 have therefore been calculated according to the values of the houses on 1 January 2021. When calculating the WOZ value, all homes are included. So also the rental properties and unsold homes. The amount of houses also changes due to new construction and demolition, which usually leads to a higher WOZ value.
Source: Omroep Brabant & Eerlijkewoz.
For Eindhoven News: Beena Arunraj


